Example: Finding Jobs by County over Years
Contents
import pandas as pd
import numpy as np
from sqlalchemy import create_engine
import sqlite3

from plotnine import *
Example: Finding Jobs by County over Years#
In this section, we will combine everything we have learned in this book so far to create a workflow for getting the number of jobs by county over many years. Here are the steps we will take:
Get WAC data and crosswalk from the internet.
Store the data within a database.
Use SQL to join the WAC to the crosswalk to get the number of jobs by county.
Create a Data Frame which we can use to create a visualization.
Graph the jobs over years by county.
Within this whole process, we will use functions and loops to make it easier to do this over many years.
Creating a New Database#
We first start by creating a new database to store our data. Creating a connection to a new database name that doesn’t exist will do this for us.
conn = sqlite3.connect("md_lodes.db")
Next, we define a function that will help us get the WAC data that we want. Try to read through the function and determine what it does. Read back to the previous Python material if you aren’t sure about some parts.
def store_wac_md(year, con):
    '''
    Gets WAC data for Maryland for a given year and stores in a database in the connection

    Arguments:
    year: Year to get data for
    con: Connection to the database

    Returns:
    None
    '''

    # Bring in data from internet
    base_url = 'https://lehd.ces.census.gov/data/lodes/LODES7/'
    file_specs = f'md/wac/md_wac_S000_JT00_{year}.csv.gz'
    file_name = base_url + file_specs
    df_md = pd.read_csv(file_name,compression='gzip')

    # Store in database
    df_md.columns = df_md.columns.str.lower()
    df_md.to_sql('md_wac_' + str(year), conn, if_exists='replace')
We then use a loop to store the data within the database we created.
for i in range(2007,2017):
    store_wac_md(i, conn)
We just need to run the process for bringing in the crosswalk data once. We’ll store that in the database too.
data_url = 'https://lehd.ces.census.gov/data/lodes/LODES7/md/md_xwalk.csv.gz'
md_xwalk = pd.read_csv(data_url,compression='gzip')
md_xwalk.columns = md_xwalk.columns.str.lower()
md_xwalk.to_sql('md_xwalk', conn, if_exists='replace')
145247
We’re going to need another function to automate doing the join, then bring that into Python as a Data Frame.
def jobs_by_county(year, conn):
    '''
    Joins the WAC to the xwalk for a given year and calculates jobs by county.

    Arguments:
    year: Year to get data for
    con: Connection to the database

    Returns:
    A Data Frame with three columns, county, jobs, and year
    '''

    base_query = f'''
    SELECT ctyname as county, count(*) as jobs, {year} as year
    FROM md_wac_{year} wac
    JOIN md_xwalk xwalk
    ON wac.w_geocode = xwalk.tabblk2010
    GROUP BY ctyname
    '''

    return pd.read_sql(base_query, conn)
jobs_by_county(2015,conn)
| county | jobs | year | |
|---|---|---|---|
| 0 | Allegany County, MD | 643 | 2015 |
| 1 | Anne Arundel County, MD | 2720 | 2015 |
| 2 | Baltimore County, MD | 4246 | 2015 |
| 3 | Baltimore city, MD | 3827 | 2015 |
| 4 | Calvert County, MD | 476 | 2015 |
| 5 | Caroline County, MD | 321 | 2015 |
| 6 | Carroll County, MD | 1263 | 2015 |
| 7 | Cecil County, MD | 663 | 2015 |
| 8 | Charles County, MD | 721 | 2015 |
| 9 | Dorchester County, MD | 325 | 2015 |
| 10 | Frederick County, MD | 1708 | 2015 |
| 11 | Garrett County, MD | 378 | 2015 |
| 12 | Harford County, MD | 1470 | 2015 |
| 13 | Howard County, MD | 1444 | 2015 |
| 14 | Kent County, MD | 291 | 2015 |
| 15 | Montgomery County, MD | 5216 | 2015 |
| 16 | Prince George's County, MD | 3423 | 2015 |
| 17 | Queen Anne's County, MD | 393 | 2015 |
| 18 | Somerset County, MD | 201 | 2015 |
| 19 | St. Mary's County, MD | 507 | 2015 |
| 20 | Talbot County, MD | 491 | 2015 |
| 21 | Washington County, MD | 1178 | 2015 |
| 22 | Wicomico County, MD | 866 | 2015 |
| 23 | Worcester County, MD | 679 | 2015 |
We’ll use a loop to get the data we want stacked on top of each other so that we have a long dataset with three columns: county, jobs, and year.
md_jobs_by_county = pd.DataFrame()
for i in range(2007,2017):
    md_jobs_by_county = pd.concat([md_jobs_by_county, jobs_by_county(i,conn)],
                                  ignore_index= True)
md_jobs_by_county.head()
| county | jobs | year | |
|---|---|---|---|
| 0 | Allegany County, MD | 1057 | 2007 |
| 1 | Anne Arundel County, MD | 3614 | 2007 |
| 2 | Baltimore County, MD | 6694 | 2007 |
| 3 | Baltimore city, MD | 4931 | 2007 |
| 4 | Calvert County, MD | 782 | 2007 |
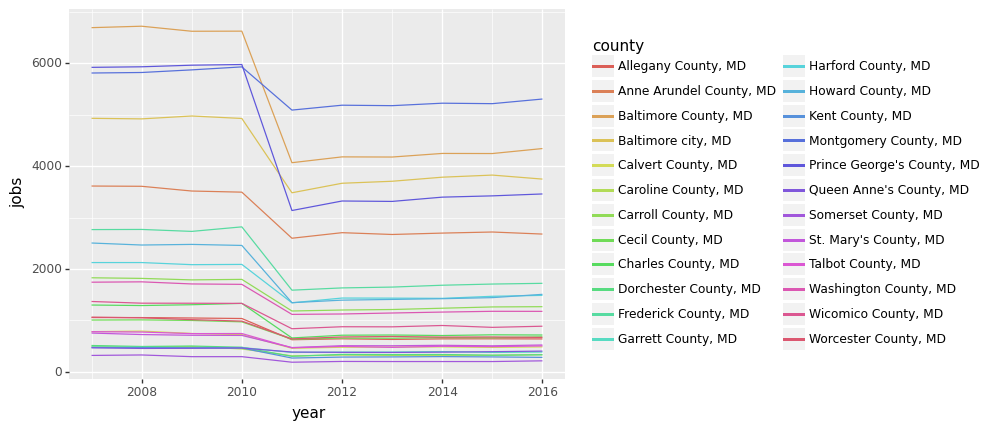
Finally, we can plot the jobs over years by county. Here, we use ggplot to do the plotting, but you can use other methods as well.
(ggplot(md_jobs_by_county)
 + aes(x = 'year', y = 'jobs', color = 'county')
 + geom_line())
<ggplot: (336039843)>
Checkpoint: Python and SQL Workflow#
Make sure you understand how all of the code above comes together. Try adjusting the code above so that the graph only has a few counties so that it is easier to read. Try doing the same for a different state.